Summary
On 24 June, the device captured a sustained, regular wide-complex tachycardia? for the first time: three consecutive strips recorded a heart rate climbing to ~205 then ~235 BPM, which then broke up and self-terminated. This is far faster than any previously recorded episode (earlier episodes topped out at 113 BPM) and is consistent with the suspected re-entrant supraventricular? tachycardia finally being caught at full speed.
Recommended action: this specific recording warrants prompt cardiology / electrophysiology review — not merely a routine appointment — and these traces should be shown directly to her clinicians. A 12-lead ECG+ (ideally captured during an episode) remains the single most important next test.
All recordings were captured using a KardiaMobile? personal ECG monitor (AliveCor), which records a single electrical lead — equivalent to Lead I? of a standard clinical ECG — by placing two fingers on the device's electrodes for ~30 seconds.
Single-lead recordings are valuable for rhythm assessment and heart rate measurement. However, they cannot provide the spatial information that a full 12-lead ECG+ offers: axis deviation, localised ST-segment changes, and multi-lead QRS morphology cannot be assessed from a single lead. This limitation matters especially for the 24 June episode (see Section 4).
36 recordings were captured across the analysis period, spanning routine/baseline recordings and several recordings taken during or around symptomatic episodes — including an extended self-monitoring session on 12 April and the high-rate episode on 24 June.
| Device interpretation | Count | Heart Rate |
|---|---|---|
| Normal Sinus Rhythm (baseline) | 26 | 64 – 100 BPM |
| Tachycardia (episode) | 5 | 100 – 113 BPM |
| Unclassified — high-rate episode (24 Jun) | 2 | 205 – 235 BPM |
| Sinus Rhythm with Wide QRS | 1 | 85 BPM |
| No Analysis: Too Short | 2 | — |
2. How the Data Was Processed
Acquisition
Raw data was downloaded in AliveCor's proprietary ATC format from the AliveCor web platform. ATC files were converted to EDF? (European Data Format), an open standard for biosignal data, using a custom parser that extracts the embedded ECG voltage samples.
Signal processing
Each full recording contains 9,000 samples at a sampling rate? of 300 Hz (300 voltage measurements per second over 30 seconds). The raw signal was processed as follows:
- Bandpass filtering (0.5 – 40 Hz) to remove baseline wander and high-frequency noise
- R-peak detection using the NeuroKit2 library's algorithm, which identifies each QRS complex+
- Wave delineation — automated identification of P-wave, QRS, and T-wave boundaries where signal quality permitted
- Interval measurement — RR, PR, QRS duration, QT, and corrected QT (QTc?) from the delineated waveforms
- Heart rate variability — time-domain metrics (SDNN?, RMSSD?) from the sequence of RR intervals
Validation
Computed heart rates were cross-checked against the device's own readings and matched throughout, confirming the data extraction is reliable.
3. ECG Findings
3.1 Heart Rate
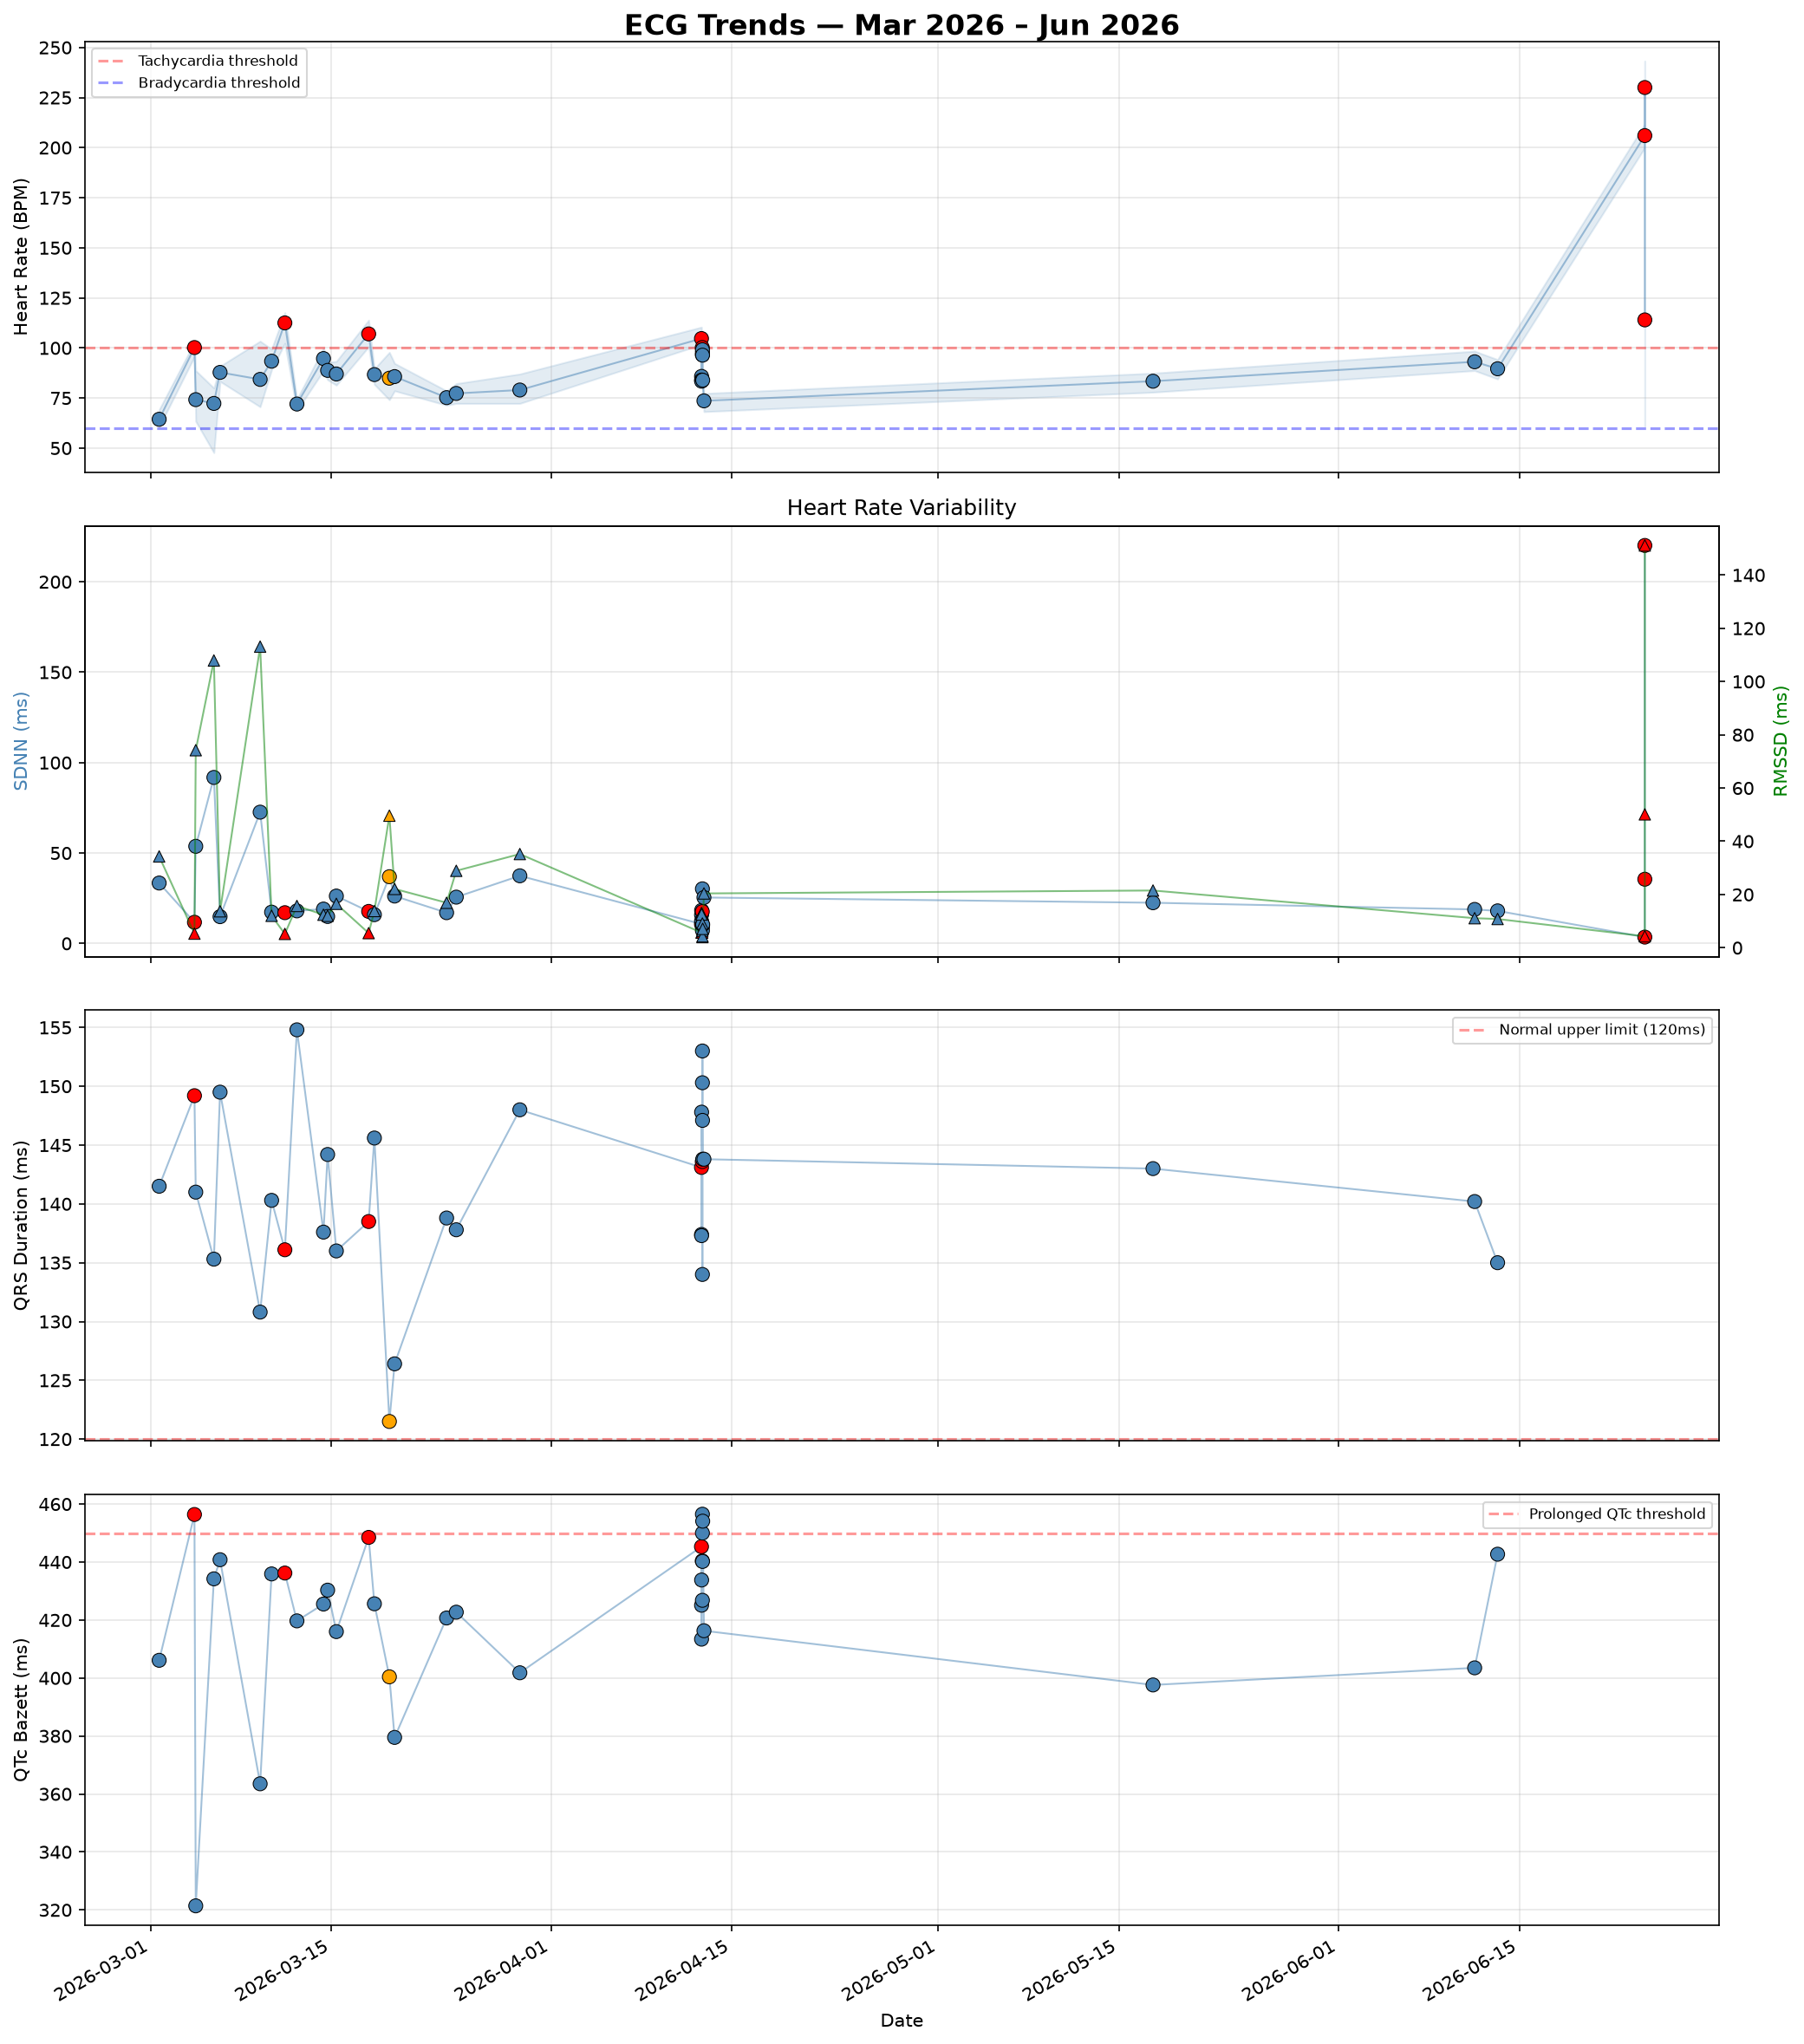
Resting heart rate during baseline recordings ranged from 64 to 100 BPM — a normal range for a lightly active adult woman. Against that backdrop, the dataset now contains a clear spectrum of tachycardia, from modest runs to a full high-rate episode:
| Date | Time | Rate | Character |
|---|---|---|---|
| Mar 04 | 09:16 AM | 100 BPM | regular, suppressed HRV |
| Mar 11 | 09:19 AM | 113 BPM | regular, suppressed HRV |
| Mar 17 | 09:07 PM | 107 BPM | regular, suppressed HRV |
| Apr 12 | 03:47 PM | 105 BPM | start of a self-monitoring session |
| Jun 24 | 05:23 PM | ~205 BPM | regular monomorphic? wide-complex |
| Jun 24 | 05:24 PM | ~235 BPM | regular monomorphic wide-complex |
| Jun 24 | 05:25 PM | irregular | episode breaking up / terminating |
The four modest episodes (100 – 113 BPM) share a distinctive signature — very regular rhythm (coefficient of variation? of RR intervals 0.02 – 0.03) and markedly suppressed heart rate variability+ (RMSSD? ~5 ms versus a baseline average of ~25 ms). This combination — regular, fast, with almost no beat-to-beat variation — points to a re-entrant tachycardia+ and is discussed in Section 4. The 24 June episode then captured the same process at full speed.
3.2 The 24 June Episode — a high-rate run captured in real time
This is the most important single recording in the dataset. Over three consecutive strips, the device captured a tachycardia accelerating to ~235 BPM and then terminating:
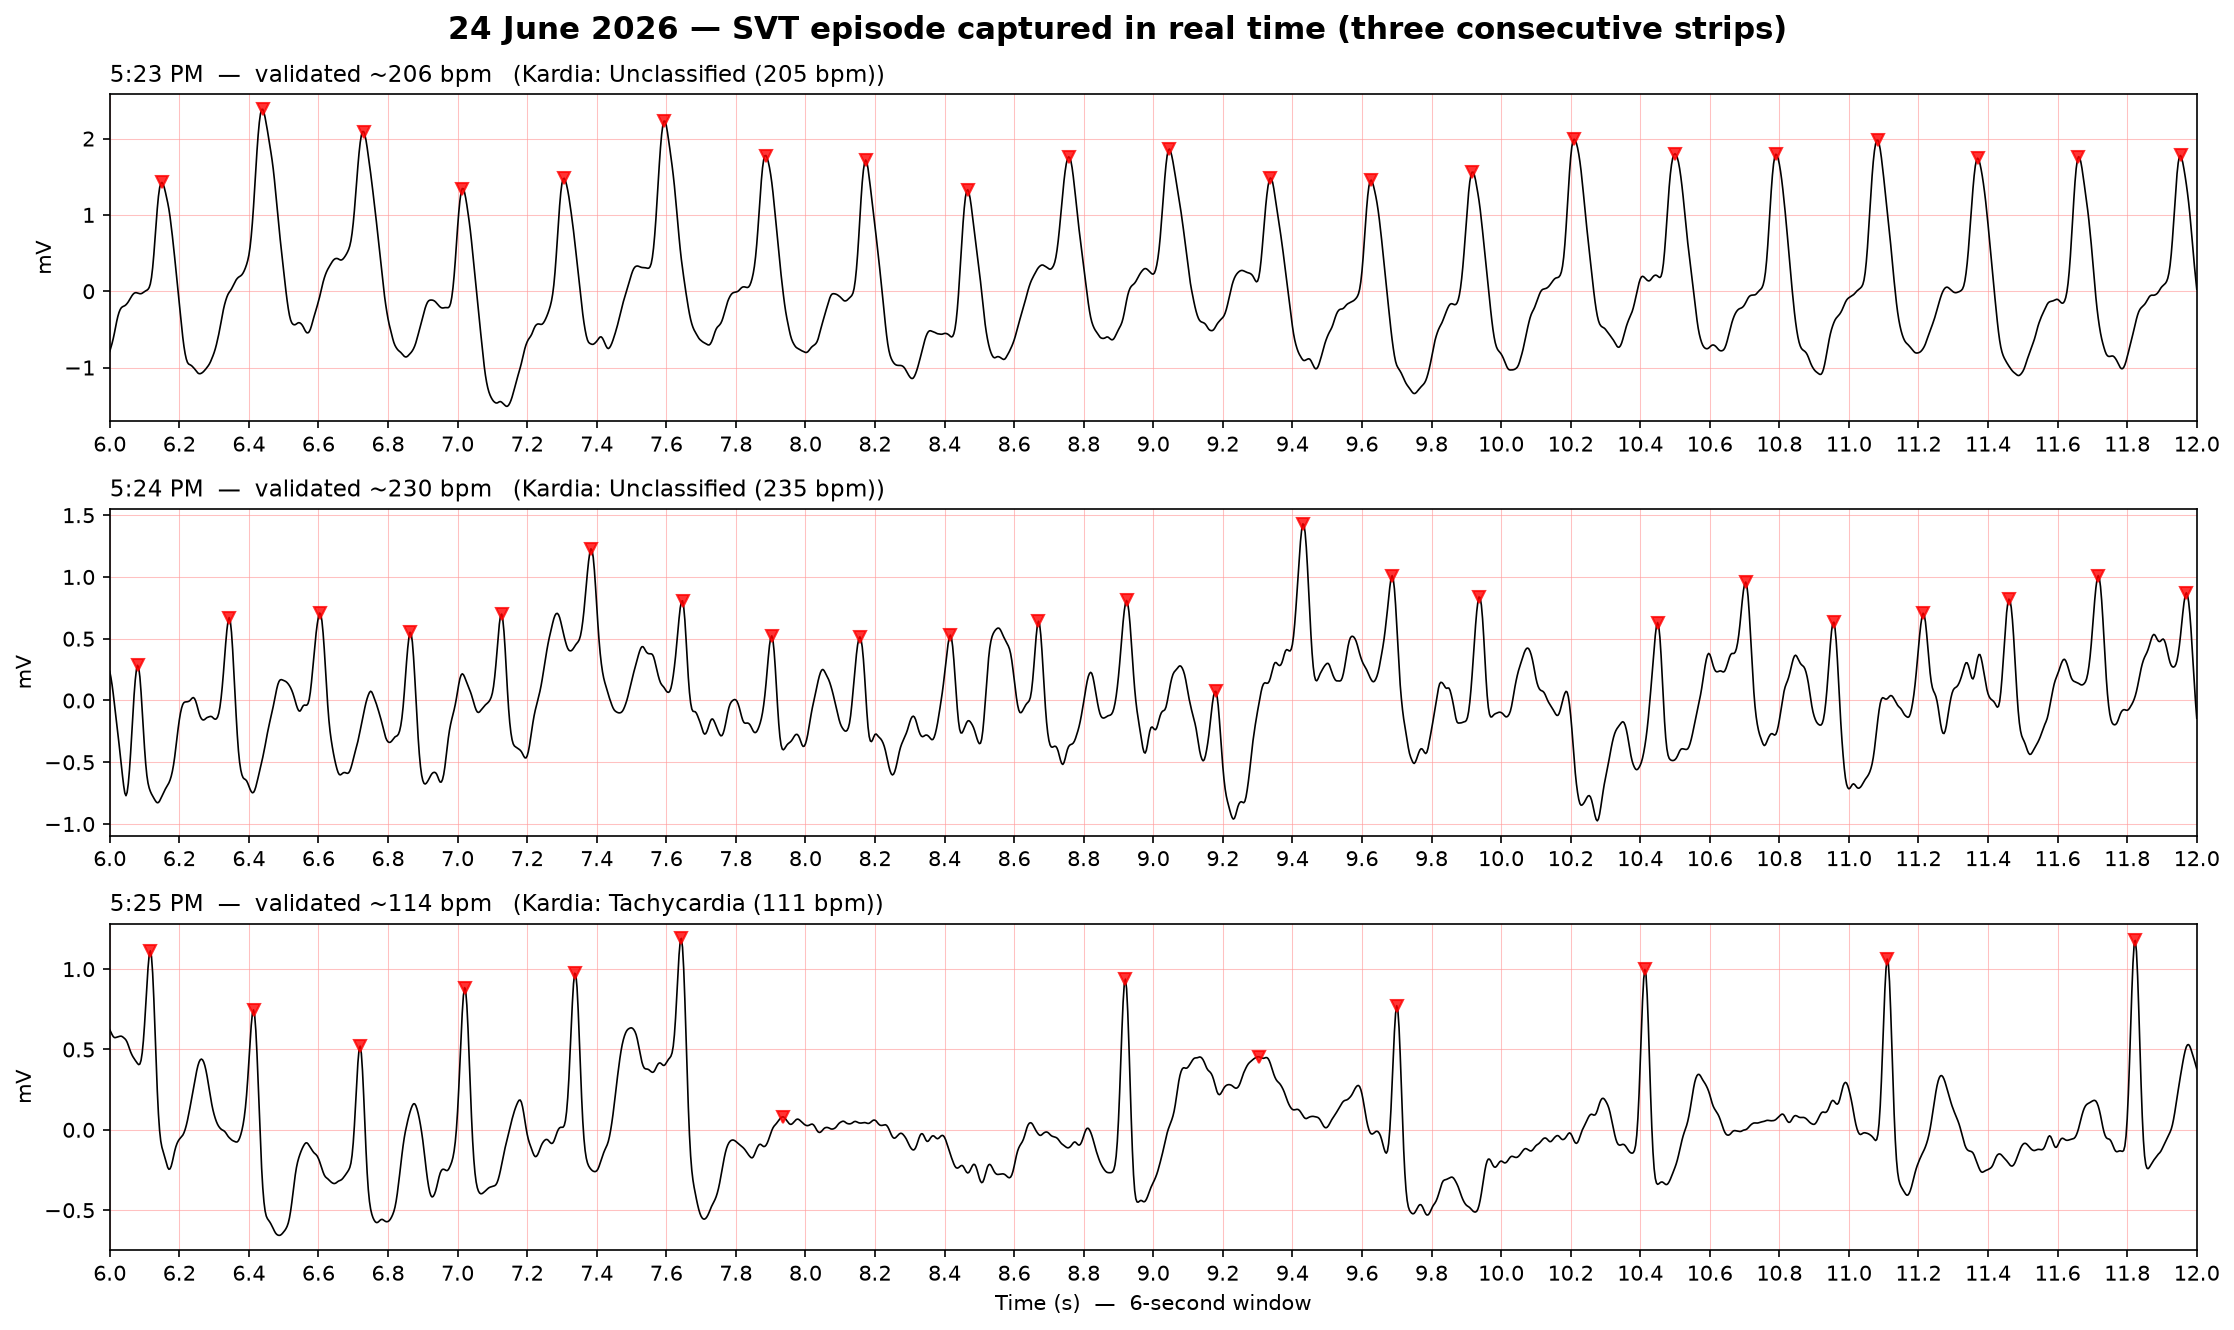
- 5:23 PM — ~205 BPM. A regular, monomorphic? wide-complex tachycardia. Beat-to-beat intervals varied by only a few milliseconds — a metronomic, fixed-rate rhythm.
- 5:24 PM — ~235 BPM. The same organised rhythm, faster still.
- 5:25 PM — terminating. The rhythm becomes irregular and slows, with a clear pause before settling — the abrupt offset that is characteristic of Paroxysmal SVT+.
Two features make this consistent with the suspected supraventricular mechanism rather than a primary ventricular problem: the rhythm is organised and regular (one stable circuit), and it self-terminated abruptly. The QRS complex+ stays wide throughout — exactly as expected if her fixed conduction abnormality (Section 3.3) simply persists during the tachycardia (aberrant conduction?). The single-lead caveat — and why this still needs a 12-lead — is covered in Section 4.
3.3 QRS Duration — Wide QRS Complex
The single most consistent finding across the entire dataset is a widened QRS complex+ in every interpretable recording:
- Mean QRS duration: 141 ms (normal: < 120 ms)
- Range: 122 – 155 ms
- Present in: every interpretable recording (33 of 33)
A QRS complex represents the electrical activation of the ventricles?. Its width reflects how quickly the signal spreads through them. Beyond 120 ms, the signal is taking longer than normal to propagate — typically because one of the two main conduction pathways (the bundle branches+) is blocked or delayed.
The consistency of this finding is important. The wide QRS is present at rest, during tachycardia, at low and high heart rates, morning and evening. This indicates a fixed conduction abnormality — something structural in the conduction system — rather than a finding that comes and goes with the episodes. The most likely explanations are Right Bundle Branch Block+, Left Bundle Branch Block+, or a non-specific Intraventricular Conduction Delay?. A single lead cannot distinguish these — one of the key reasons a 12-lead ECG is needed (Section 7).
3.4 Heart Rate Variability (HRV)
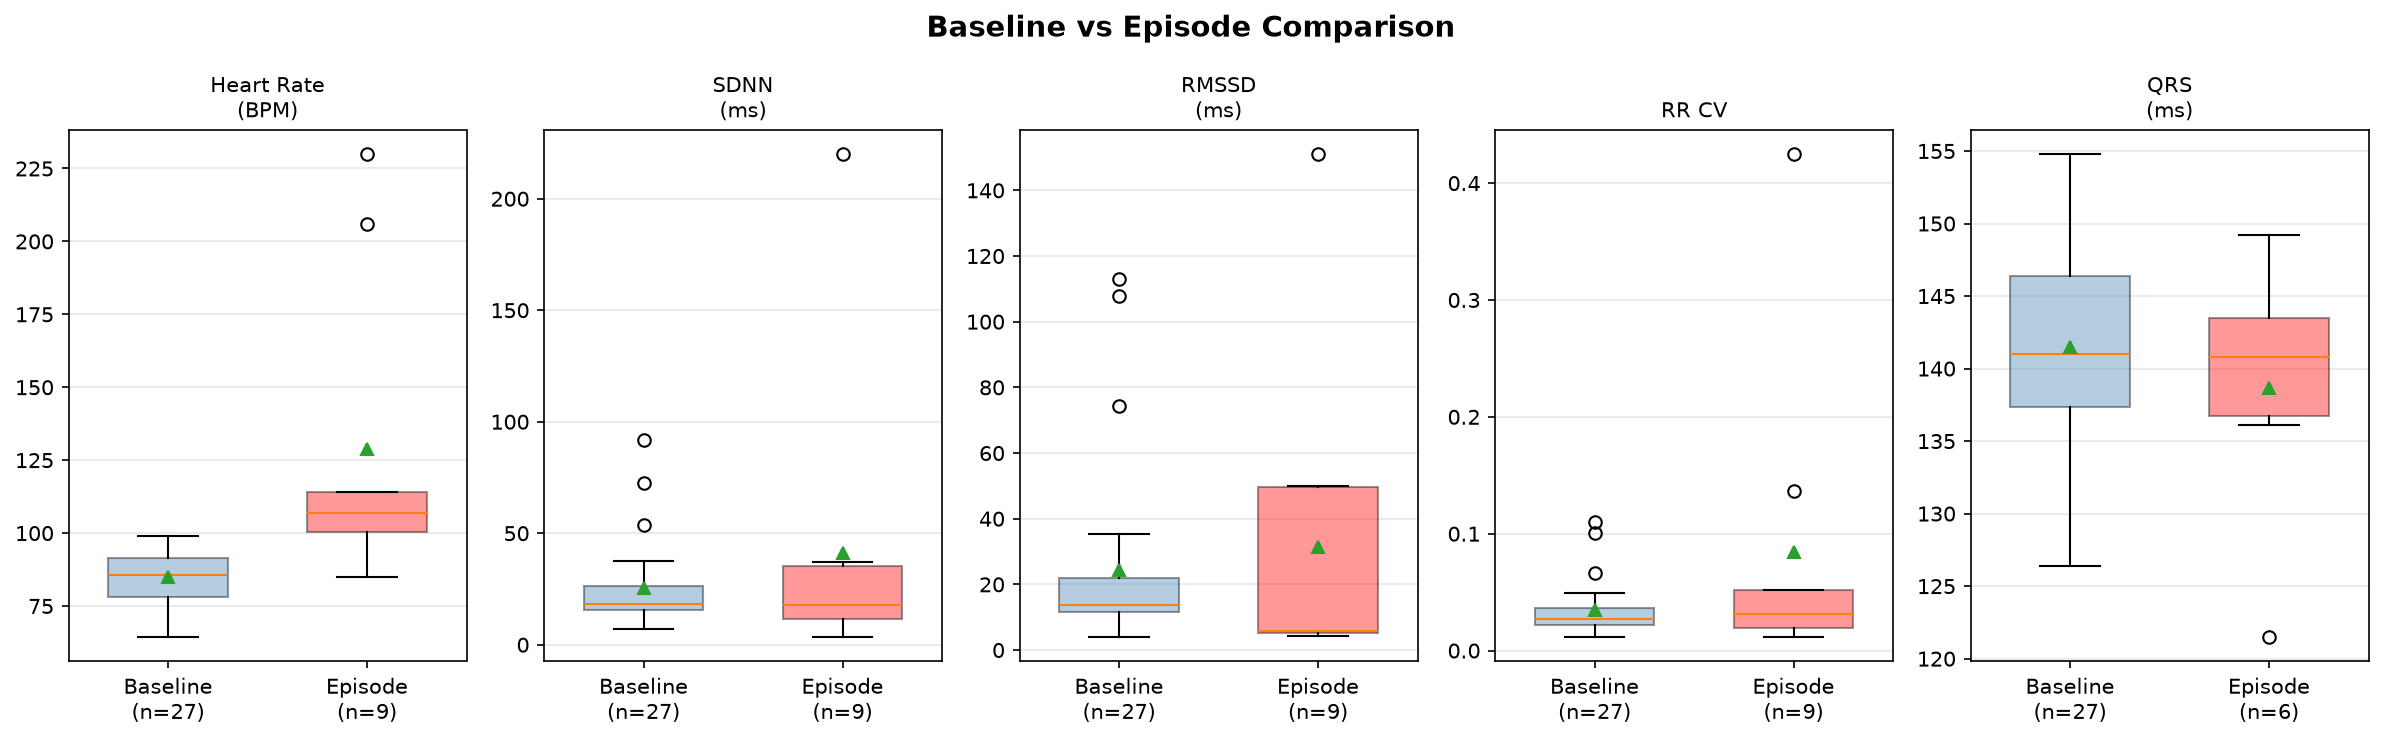
Heart rate variability+ measures the natural fluctuation in time between successive heartbeats. Two metrics were measured: SDNN? (overall variability) and RMSSD? (beat-to-beat variability, particularly sensitive to the parasympathetic nervous system?).
| Baseline (n=29) | Regular episodes (n=4) | |
|---|---|---|
| SDNN | 25.4 ± 18.5 ms | 14.3 ± 3.1 ms |
| RMSSD | 24.7 ± 27.5 ms | 5.4 ± 0.2 ms |
The RMSSD finding is striking and remarkably consistent: ~5 ms during every regular tachycardia episode versus ~25 ms at baseline. Across all four modest episodes RMSSD landed between 5.2 and 5.7 ms — a near-identical, near-total suppression of beat-to-beat variability. This indicates the heart rate during episodes is not being modulated by normal autonomic control. It is characteristic of a re-entrant tachycardia+, where the rate is set by the fixed length of an electrical circuit rather than by the sinus node+.
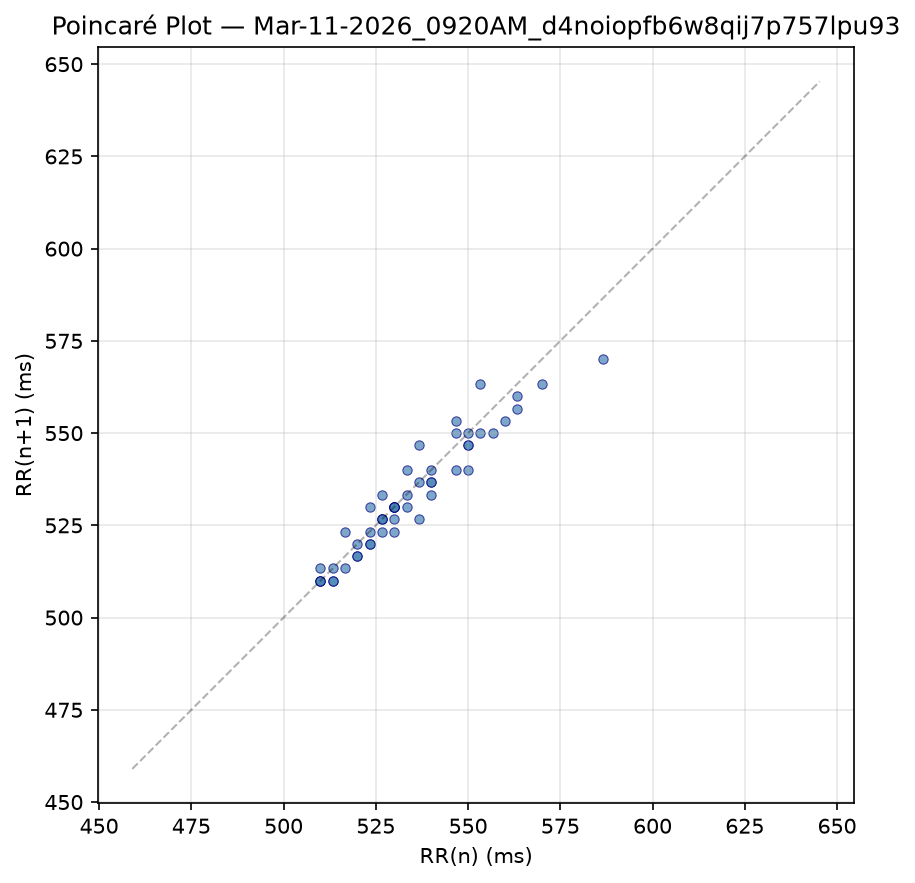
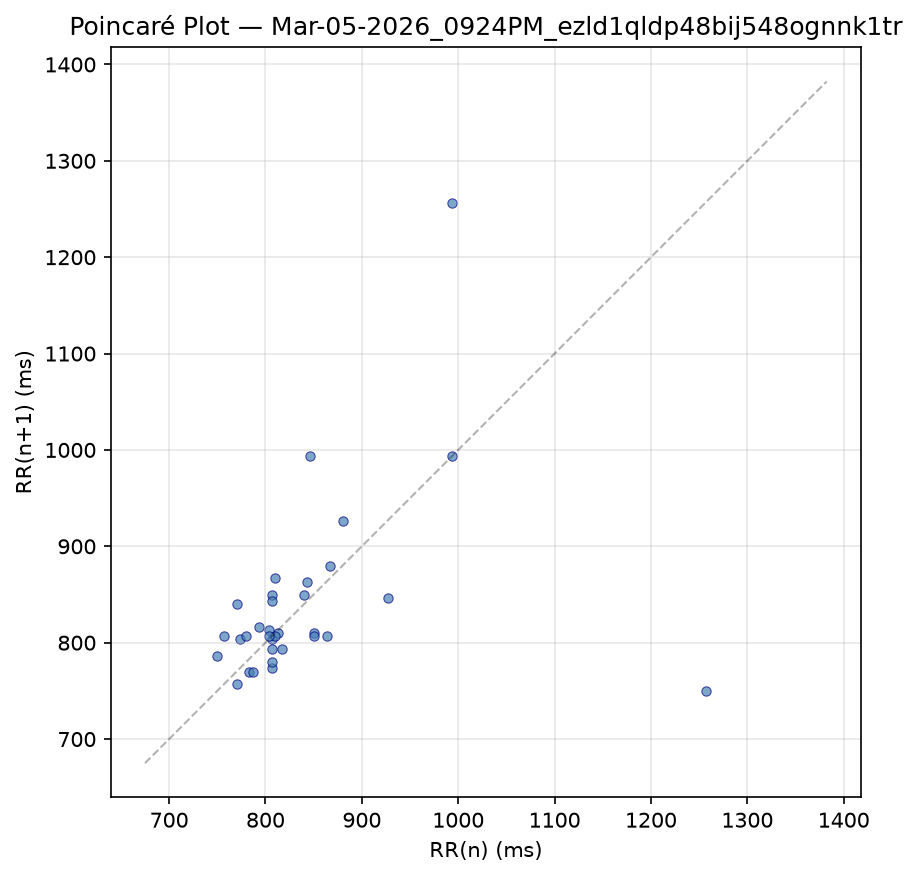
3.5 Poincaré Plots
Poincaré plots? provide a visual fingerprint of rhythm regularity by plotting each beat-to-beat interval against the next.
3.6 QTc Interval
The QT interval+ represents the time for the ventricles to activate and reset. Corrected for heart rate (QTc?, Bazett's formula?):
- Baseline mean QTc: 419 ms (normal for women: < ~460 ms)
- A handful of borderline values (450 – 456 ms) appear in the 12 April cluster, all at rates near 99 – 100 BPM, where Bazett's formula is known to overcorrect. Fridericia's formula? would likely place these within the normal range.
No clinically significant QT prolongation is evident. It remains worth monitoring, particularly if any QT-prolonging medication is prescribed in future.
3.7 The 12 April Cluster
On 12 April, eleven strips were recorded between 3:48 PM and 8:23 PM — a self-monitoring session around a symptomatic episode. The first strip (3:47 PM) was a 105 BPM tachycardia; the rhythm then settled into the high-90s through the late afternoon and gradually returned to the low 70s by evening. Several of these strips show a regular ~96 – 100 BPM rhythm with suppressed RMSSD (4 – 6 ms), resembling the tail of an episode or a slow run rather than ordinary sinus rhythm. The wide QRS persists throughout. This cluster is a useful record of what the aftermath of an episode looks like — and a reminder that capturing the onset remains valuable.
3.8 Summary of Measurements
Rows marked * are episodes or abnormal captures. A dash marks values that cannot be measured at very high rates.
| Date | Time | HR | RR CV | SDNN | RMSSD | QRS | QTc | Device Finding |
|---|---|---|---|---|---|---|---|---|
| Mar 01 | 03:40PM | 64 | 0.036 | 33 | 34 | 142 | 406 | Normal Sinus Rhythm |
| Mar 04 | 09:16AM | 100 | 0.020 | 12 | 5 | 149 | 456 | Tachycardia |
| Mar 04 | 11:41AM | 74 | 0.066 | 54 | 74 | 141 | 321 | Normal Sinus Rhythm |
| Mar 05 | 09:23PM | 72 | 0.110 | 92 | 108 | 135 | 434 | Normal Sinus Rhythm |
| Mar 06 | 08:51AM | 88 | 0.022 | 15 | 14 | 150 | 441 | Normal Sinus Rhythm |
| Mar 09 | 11:23AM | 84 | 0.101 | 73 | 113 | 131 | 364 | Normal Sinus Rhythm |
| Mar 10 | 08:41AM | 93 | 0.027 | 17 | 12 | 140 | 436 | Normal Sinus Rhythm |
| Mar 11 | 09:19AM | 112 | 0.032 | 17 | 5 | 136 | 436 | Tachycardia |
| Mar 12 | 07:43AM | 72 | 0.022 | 18 | 16 | 155 | 420 | Normal Sinus Rhythm |
| Mar 14 | 09:07AM | 95 | 0.030 | 19 | 12 | 138 | 426 | Normal Sinus Rhythm |
| Mar 14 | 04:49PM | 89 | 0.022 | 15 | 12 | 144 | 430 | Normal Sinus Rhythm |
| Mar 15 | 09:02AM | 87 | 0.038 | 26 | 16 | 136 | 416 | Normal Sinus Rhythm |
| Mar 17 | 09:07PM | 107 | 0.032 | 18 | 6 | 138 | 448 | Tachycardia |
| Mar 18 | 07:43AM | 87 | 0.023 | 16 | 14 | 146 | 426 | Normal Sinus Rhythm |
| Mar 19 | 11:37AM | 85 | 0.052 | 37 | 50 | 122 | 400 | Sinus Rhythm with Wide QRS |
| Mar 19 | 09:19PM | 86 | 0.037 | 26 | 22 | 126 | 380 | Normal Sinus Rhythm |
| Mar 23 | 09:59PM | 75 | 0.021 | 17 | 17 | 139 | 421 | Normal Sinus Rhythm |
| Mar 24 | 03:58PM | 77 | 0.033 | 26 | 29 | 138 | 423 | Normal Sinus Rhythm |
| Mar 29 | 02:08PM | 79 | 0.049 | 37 | 35 | 148 | 402 | Normal Sinus Rhythm |
| Apr 12 | 03:47PM | 105 | 0.019 | 11 | 6 | 143 | 445 | Tachycardia |
| Apr 12 | 03:55PM | 86 | 0.023 | 16 | 13 | 137 | 413 | Normal Sinus Rhythm |
| Apr 12 | 03:56PM | 84 | 0.017 | 12 | 13 | 137 | 425 | Normal Sinus Rhythm |
| Apr 12 | 04:02PM | 83 | 0.025 | 18 | 12 | 148 | 434 | Normal Sinus Rhythm |
| Apr 12 | 05:18PM | 100 | 0.029 | 18 | 6 | 144 | 440 | Normal Sinus Rhythm |
| Apr 12 | 05:30PM | 97 | 0.015 | 9 | 6 | 134 | 427 | No Analysis: Too Short |
| Apr 12 | 05:32PM | 98 | 0.049 | 30 | 9 | 150 | 450 | Normal Sinus Rhythm |
| Apr 12 | 05:33PM | 99 | 0.012 | 7 | 4 | 153 | 456 | Normal Sinus Rhythm |
| Apr 12 | 05:43PM | 96 | 0.017 | 10 | 4 | 147 | 440 | Normal Sinus Rhythm |
| Apr 12 | 06:03PM | 84 | 0.015 | 10 | 7 | 144 | 454 | Normal Sinus Rhythm |
| Apr 12 | 08:23PM | 74 | 0.031 | 25 | 20 | 144 | 416 | Normal Sinus Rhythm |
| May 17 | 03:09PM | 83 | 0.031 | 22 | 22 | 143 | 398 | No Analysis: Too Short |
| Jun 11 | 01:04PM | 93 | 0.029 | 19 | 11 | 140 | 404 | Normal Sinus Rhythm |
| Jun 13 | 07:43AM | 90 | 0.027 | 18 | 11 | 135 | 443 | Normal Sinus Rhythm |
| Jun 24 | 05:23PM | ~206 | — | — | — | — | — | Unclassified |
| Jun 24 | 05:24PM | ~235 | — | — | — | — | — | Unclassified |
| Jun 24 | 05:25PM | var. | — | — | — | — | — | Tachycardia |
4. Possible Diagnoses
The data, combined with the symptom history, continues to point toward two concurrent findings — one explaining the episodes, one explaining the wide QRS — with the 24 June recording now showing the episodes at full intensity.
4.1 Paroxysmal Supraventricular Tachycardia (SVT) — the episodes
Paroxysmal SVT+ refers to episodes of abnormally fast rhythm originating above the ventricles that start and stop suddenly. The symptom history is highly characteristic:
- Sudden onset and offset — episodes begin and end abruptly, like a switch. The 24 June strips captured exactly this offset.
- Duration of minutes to hours — too long to be a brief run of ectopic beats, but self-terminating
- Termination by a vagal stimulus — at least one episode ended immediately after a yawn, a natural vagal manoeuvre+ that slows conduction through the AV node+
- No clear trigger — episodes appear random
The ECG data supports this: the episodes are regular (RR CV 0.02 – 0.03) with suppressed HRV (RMSSD ~5 ms), and the 24 June episode was organised and monomorphic even at 235 BPM. The two most likely mechanisms are AVNRT+ (≈60% of SVT) and AVRT+ (≈30%, involving an accessory pathway+).
The high rate now documented (205 – 235 BPM) answers a question left open by the earlier analysis, which noted that only modest rates had been captured and "the fastest episodes may not yet have been recorded." They now have been — and 200+ BPM is well within the expected range for AVNRT/AVRT.
4.2 Wide-complex tachycardia — why the 24 June trace still needs a 12-lead
Because her QRS is wide at baseline, her SVT appears as a wide-complex tachycardia?. The most likely explanation is straightforward: a supraventricular rhythm conducting through her existing fixed conduction block (aberrant conduction?). Two other possibilities must be kept on the table until a 12-lead is obtained:
- Pre-excited / antidromic AVRT+ (Wolff-Parkinson-White+). An accessory pathway+ could explain both the wide QRS and the episodes as a single diagnosis, and would show delta waves+ on a resting 12-lead.
- ventricular tachycardia+. Less likely here given the abrupt self-termination, the patient remaining well, and the strong supraventricular history — but a single lead cannot fully exclude it when the QRS is wide. This is the main reason the 24 June recording deserves prompt specialist review.
4.3 Bundle Branch Block — the wide QRS
The persistent wide QRS (mean 141 ms) across all recordings, regardless of rate or rhythm, indicates a fixed conduction delay in one of the bundle branches+. From a single lead it is not possible to determine whether this is a Right Bundle Branch Block+ (often benign) or a Left Bundle Branch Block+ (which more often warrants an echocardiogram in someone under 50). A 12-lead ECG resolves this and simultaneously checks for delta waves.
5. Prognosis
If the diagnosis is SVT (AVNRT or AVRT) with an incidental conduction abnormality
This remains the most likely scenario, and the outlook is very reassuring:
- SVT is not life-threatening in a structurally normal heart. A documented rate of 235 BPM is uncomfortable and can cause palpitations, breathlessness or light-headedness, but is not in itself dangerous in a structurally normal heart.
- No impact on life expectancy. People with paroxysmal SVT have normal lifespans.
- It is highly curable. Catheter ablation+ has a success rate exceeding 95% for AVNRT and AVRT, with a very low complication rate.
- A bundle branch block, if confirmed as isolated, does not affect prognosis or daily life.
If the diagnosis is WPW syndrome
The outlook remains good, with the added consideration that once Wolff-Parkinson-White+ is identified, ablation of the accessory pathway is generally recommended and is curative.
Overall
A 48-year-old woman who is active and otherwise well, with episodic SVT and a conduction abnormality in a (likely) structurally normal heart, carries an excellent prognosis. The 24 June episode raises the priority of specialist assessment but does not change this fundamentally positive outlook — it gives her clinicians the clear, high-quality recording they need to act on.
6. Lifestyle and Treatment
During an episode
Vagal manoeuvres+ can terminate an SVT episode by stimulating the vagus nerve to slow conduction through the AV node:
- Modified Valsalva (most effective): sit semi-reclined, blow hard into a closed fist or 10 mL syringe for 15 seconds, then immediately lie flat and have someone lift both legs to 45° for 15 seconds. The key is the release and leg elevation.
- Cold water stimulus: submerge the face in cold water for 10 – 15 seconds, triggering the diving reflex?.
- Carotid sinus massage — only under clinician instruction.
If manoeuvres do not work within 1 – 2 attempts, or if an episode is accompanied by chest pain, severe breathlessness, or near-fainting, seek medical attention. A&E can administer intravenous adenosine?, which terminates most SVT episodes within seconds. Given an episode has now been documented at 235 BPM, it is reasonable to have a clear plan agreed with her GP/cardiologist for what to do during the next one.
Lifestyle
- No activity restrictions are needed for SVT with a structurally normal heart.
- Manage triggers where possible: caffeine, alcohol, dehydration, poor sleep, and stress can all lower the threshold. A short symptom diary noting activity, food/drink, sleep and stress around episodes may reveal patterns.
- Stay well-hydrated and maintain electrolyte balance (particularly potassium and magnesium).
Medical treatment
- Pill-in-the-pocket — a single dose (e.g. flecainide or a beta-blocker) taken at episode onset, for infrequent episodes.
- Daily medication — beta-blockers, calcium channel blockers, or antiarrhythmics, if episodes are frequent or disruptive.
- Catheter ablation+ — the definitive treatment and potential cure (>95% success for AVNRT/AVRT). For recurrent SVT affecting quality of life, ablation is generally recommended over long-term medication.
7. Areas for Further Investigation
7.1 12-Lead ECG — Priority: High
A standard clinical ECG recording from 12 angles simultaneously. It is essential to classify the bundle branch block, look for delta waves+ (WPW), and assess ST segments and T waves that a single lead cannot show. Capturing a 12-lead during an episode would be especially valuable — it would settle the wide-complex tachycardia question (SVT-with-aberrancy vs pre-excitation vs VT) definitively. Takes ~5 minutes at a GP surgery.
7.2 Prompt Cardiology / Electrophysiology Referral — Priority: High (raised by the 24 June episode)
A regular wide-complex tachycardia documented at 205 – 235 BPM warrants specialist review sooner rather than later. An electrophysiologist can interpret the captured strips, arrange appropriate monitoring, and discuss definitive management (including catheter ablation+). The 24 June recordings should be brought to this appointment.
7.3 Echocardiogram — Priority: High (especially if LBBB is confirmed)
An ultrasound of the heart to confirm it is structurally normal (chamber sizes, wall thickness, valve function, ejection fraction?). Particularly important if a Left Bundle Branch Block+ is confirmed, and provides reassurance that the SVT is occurring in an otherwise healthy heart.
7.4 Extended / Ambulatory Monitoring — Priority: Moderate
A Holter (24 – 48 h) or patch monitor (up to 14 days) records every beat, capturing the onset and termination of episodes (which distinguishes AVNRT from AVRT from atrial tachycardia), quantifying episode burden, and assessing the two high-variability baseline recordings (Mar 5, Mar 9) for any ectopic beats?.
7.5 Blood Tests — Priority: Moderate
Thyroid function (hyperthyroidism is a common, treatable cause of palpitations), full blood count (anaemia), and electrolytes (potassium, magnesium) to rule out reversible contributors.
Common Questions
Will a 12-lead ECG still give useful information if I'm not having an episode at the time?
Yes — a resting 12-lead between episodes is one of the most useful next tests, because the two biggest open questions are both resting findings rather than episode findings:
- It classifies the wide QRS. The widened QRS complex+ is present in every recording, whether or not an episode is happening. The chest leads (V1–V6) that a single-lead device can't capture are exactly what distinguishes Right Bundle Branch Block+, Left Bundle Branch Block+, and a nonspecific delay — a distinction that changes the follow-up.
- It's the best chance to spot WPW. A delta wave+ — the signature of an accessory pathway+ (Wolff-Parkinson-White+) — appears during normal rhythm, not necessarily during the tachycardia. If it's there, it ties the wide QRS and the episodes into a single diagnosis.
- It sets a baseline. A clean reference for PR interval, axis and QTc? across all 12 leads — and something to compare against if an episode is ever caught on a 12-lead.
The one limit: a resting trace won't capture the tachycardia itself, so it complements rather than replaces catching an episode with a Holter or event monitor. Bottom line: it's worth doing soon, with no need to wait for an episode.
8. Conclusion
Analysis of 36 single-lead recordings over ~16 weeks reveals two concurrent findings:
- Paroxysmal tachycardia episodes with features strongly suggestive of a re-entrant supraventricular tachycardia (most likely AVNRT+ or AVRT+) — supported by the history of sudden onset/offset, vagal termination, and the ECG signature of a regular, fixed-rate rhythm with suppressed variability. On 24 June this was captured at 205 – 235 BPM, confirming the episodes can reach high rates and then self-terminate.
- A fixed wide QRS (mean 141 ms) present in every interpretable recording, indicating a bundle branch block or conduction delay that requires classification by 12-lead ECG. Because the QRS is wide at baseline, the episodes appear as a wide-complex tachycardia — which, while almost certainly supraventricular, cannot have a ventricular origin fully excluded from a single lead.
The overall picture — an active, otherwise-well 48-year-old with episodic SVT and a conduction abnormality in a likely structurally normal heart — carries an excellent prognosis. The recommended path forward:
- 12-lead ECG (via GP — soon; ideally also captured during an episode)
- Prompt cardiology / electrophysiology referral, bringing the 24 June recordings
- Echocardiogram (via GP referral)
- Continue KardiaMobile recordings during episodes — capturing the very start of one would be particularly valuable